When writing assembly in Real Mode as 16 bit, all posts online (stackoverflow, etc) all talk from the perspective of developing on Linux. However in this blogpost we’ll go through how easy it is to adapt these techniques to work from a Windows host, and get Cygwin GDB to understand segments, break at segment offsets, and view the linear address space.
Background
A quick recap on 16 bit real mode in case you have forgotten.
- Real mode = 16-bit unprotected addressing mode
- 8086 processor operates exclusively in real mode
- 80286 and later x86 compatible processors, can operate in real mode as well others (protected/long mode)
- Can call BIOS interrupts from real mode
- Bootloaders will start in real mode
- Need to use segmentation (segment:offset) via segment registers CS, DS, ES, FS, GS and SS to access up to 1MiB
- Access up to 1MiB of memory via linear addressing – since we have 16 non-overlapping segments which can access 64 KiB each, that gives us 1MiB.
- Linear Address = (Segment * 16) + Offset
- Enable A20 gate to access more than 1MiB or memory.
- Essentially when the CPU calculates a linear address, by default the Offset is truncated to fit in 16 bits (64 KiB wraparound).
- However with the (Segment * 16), if A20 line is inactive the result is truncated to fit into 20 bits (1 MiB wraparound).
- But if A20 line is active no wraparound occurs hence access to > 1MiB.
Requirements
- Windows 10 host
- QEMU (64 bit) for Windows (https://www.qemu.org/download/#windows)
- Cygwin (https://www.cygwin.com/setup-x86_64.exe)
- Tick whatever GNU utilities you want, but be sure tick
All/Devel/gdb
- Tick whatever GNU utilities you want, but be sure tick
- Download these 3 GDB helper scripts (designed for GDB under Linux, but works just fine in Windows Cygwin GDB):
Attach debugger
Run your 16 bit real mode code in QEMU, e.g. a 16 bit bootloader, or a 16 bit OS, or 16 bit MS-DOS. If it’s a bootloader, the BIOS will load your 512 byte bootloader from the MBR of your storage volume into memory at CS:IP 0x0000:0x7C00. Use qemu-system-i386.exe so to emulate legacy hardware for better support in 16 bit Real Mode. Add -s so QEMU starts a gdbserver at localhost:1234 allowing your Windows GDB to connect. Add -S so QEMU adds a breakpoint at POST in SeaBIOS (legacy BIOS used by QEMU). An example command would be:
qemu-system-i386.exe -drive format=raw,index=0,if=floppy,file=Build/floppydisk.img -s -S
Now QEMU will be frozen at the POST stage, awaiting your debugger connection.
Start Cygwin, and change directory to wherever you stored the 3 above GDB helper scripts, then run the script helpers and set a breakpoint at your entrypoint e.g. for a bootloader this 0x7C00.
gdb.exe -ix "gdb_init_real_mode.txt" -ex "set tdesc filename target.xml" -ex "target remote localhost:1234" -ex "br *0x7c00" -ex "c"
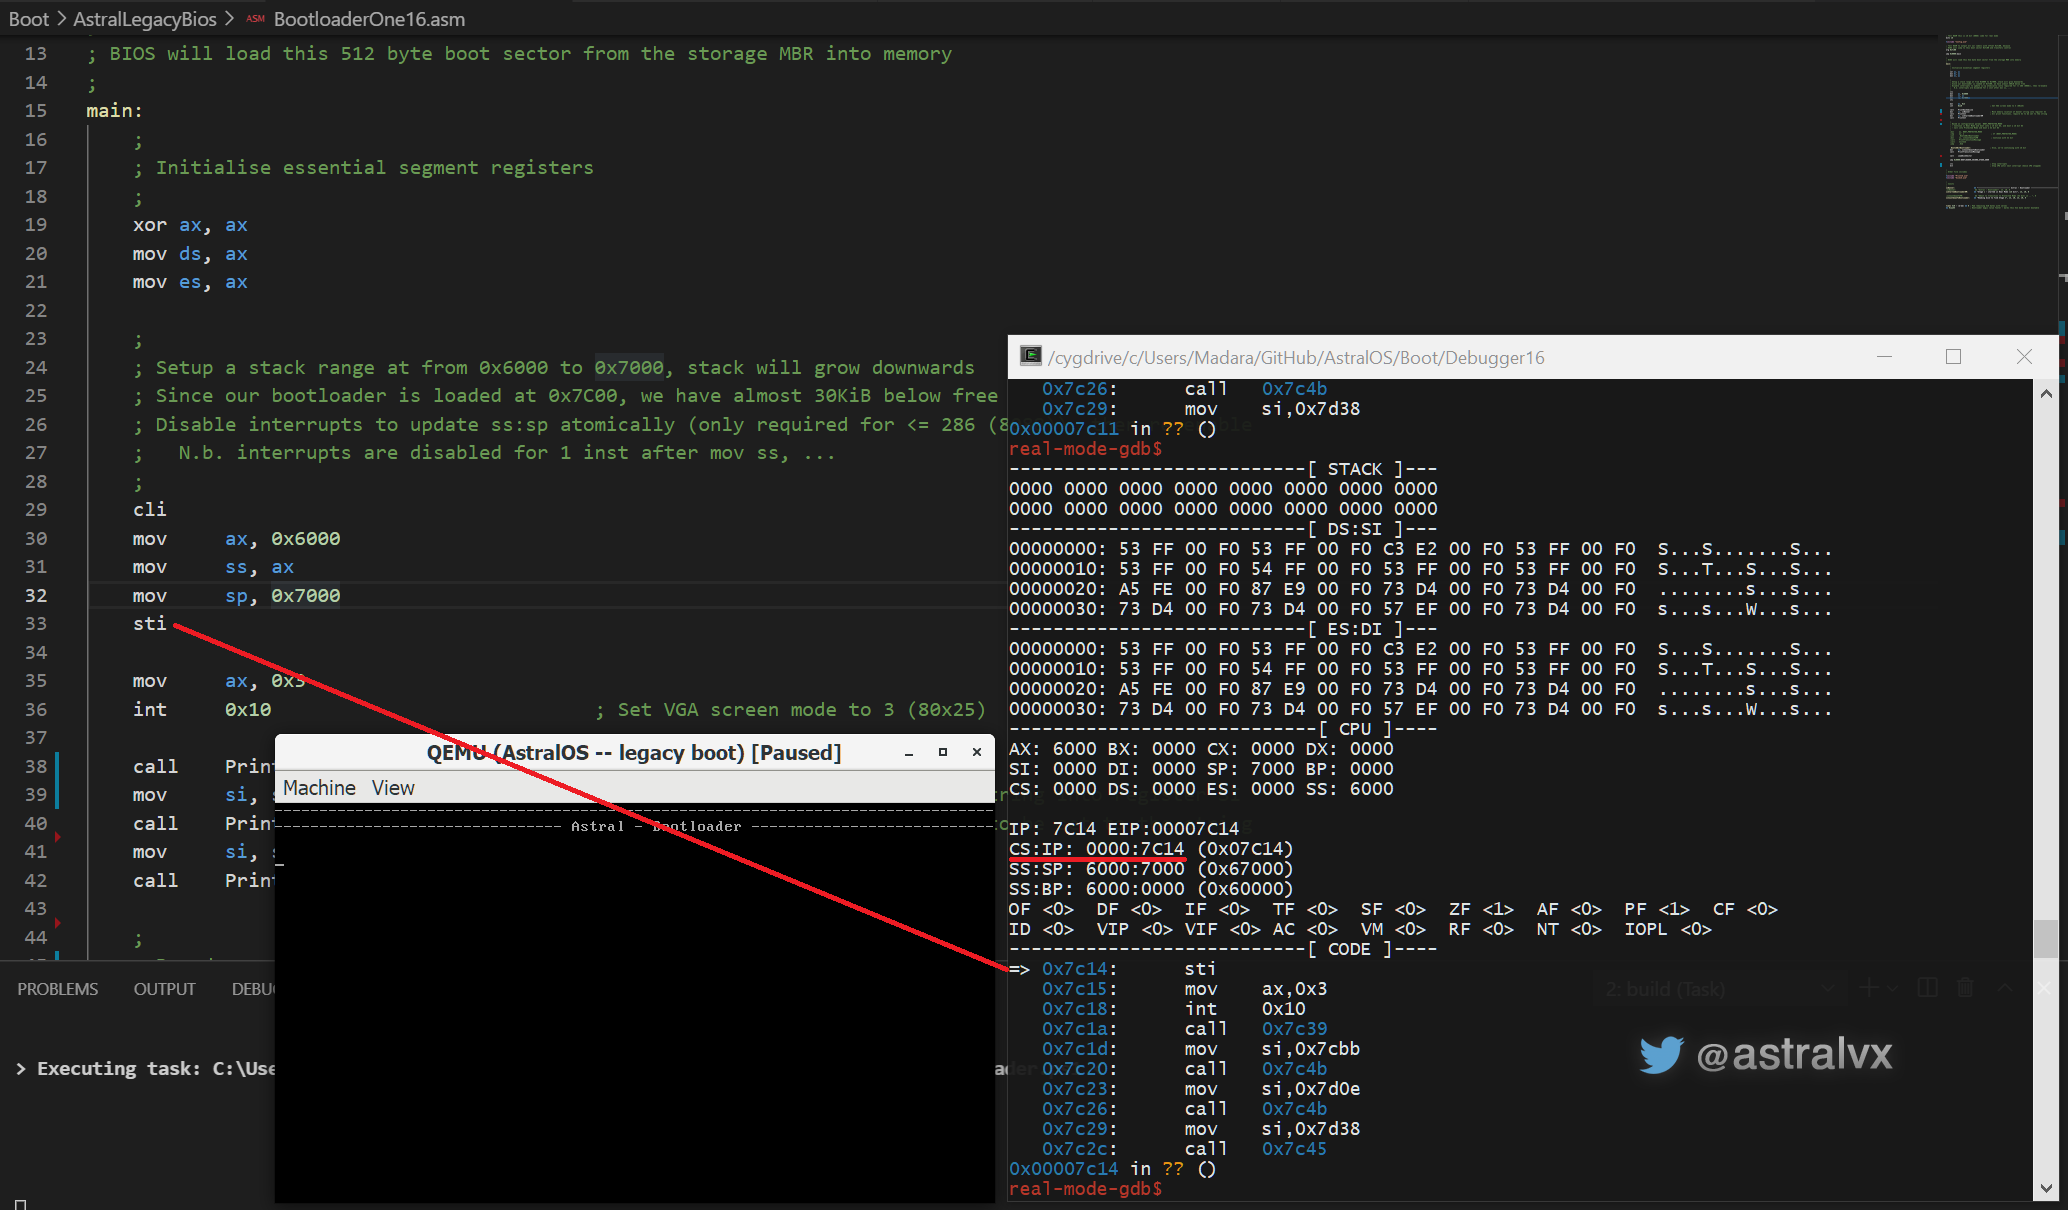
Run a few stepo (helper macro to deal with stepping over interrupts etc) to get to the entry point, and notice the match between GDB and VSCode, and display of segment registers correctly.
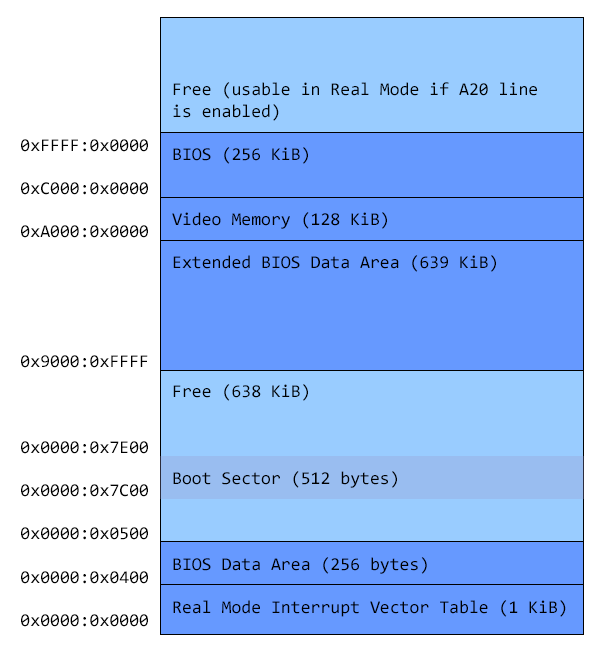
And of course you can view the memory map quite easily from GDB. In the image below you can see a typical 8086 memory map, take it with a grain of salt as legacy BIOS devs can move things around to fit their needs. But generally BIOS is at 0xC000 to 0xFFFF, bootloader will be loaded at 0x7C00, IVT will be at 0x0000, free space however could be used as needed.
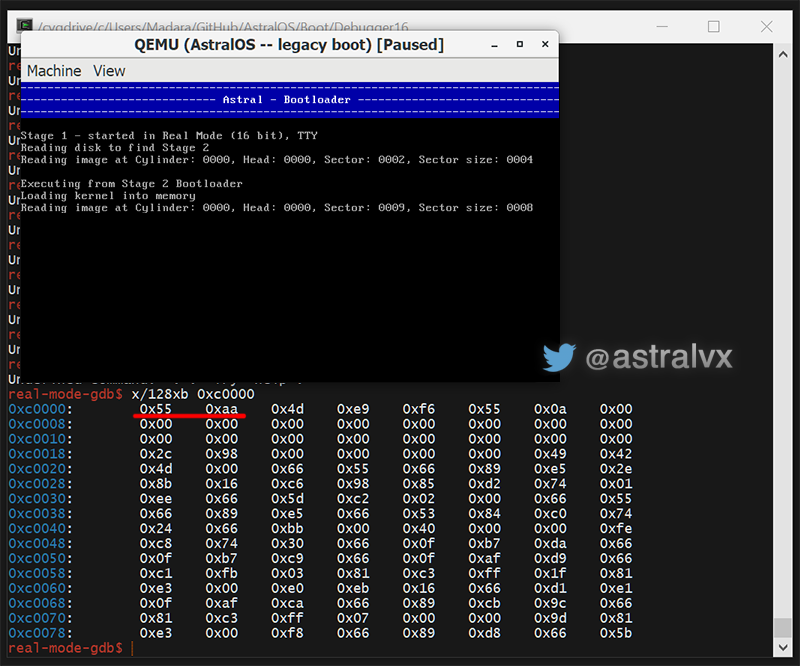
Now if we want to view the memory map. Remember the linear address calculation from above (Segment * 16 + offset). So let’s view the BIOS used by QEMU at 0xC000:0x0000. Calculation is (0xC000*16 + 0x0000) giving us a linear address of 0xC0000. So in GDB x/128xb 0xC00000. Then look at that, 0x55 0xAA, the BIOS magic header bytes.
Happy real mode development from within Windows, and calling glorious BIOS interrupts. Share and like my ![]() tweet if you enjoyed the article (:
tweet if you enjoyed the article (: